In the ALAMEDA project various sensors are deployed to monitor patients at home or in clinic. A significant factor for selection of the sensors was the obtrusiveness towards the patients. We investigated on the physical measurements we could make while being unobtrusive.
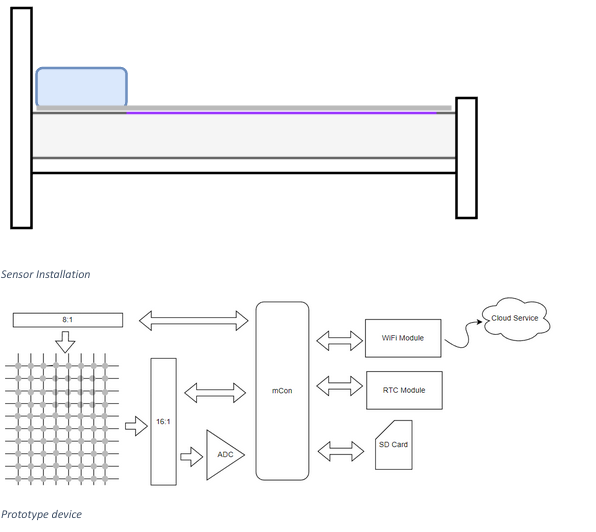
The pressure sensor matrix is an 8x16 array of velostat films. The difference in applied to the film is proportionally to the resistance of the sensor. To measure this resistance with an electronic circuit (analog to digital converter – ADC) we use the following resistor-based circuit to convert it to a voltage. The Rx is the unknown value of the resistance of velostat that is measure by the ADC of the matrix.
ENORA Prototype Mattress Topper Overview
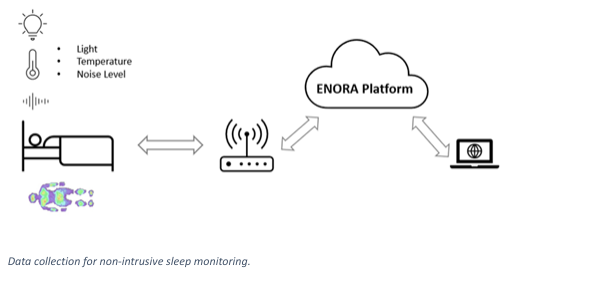
Sleep monitoring for brain diseases, as it has been supported and identified in Task 2.1, is a crucial variable for all the three use cases considered in ALAMEDA and is related with several aspects of the diseases’ status assessment. Unobtrusive sleep monitoring does not require any wearable devices or interventions from the monitored persons. The main modalities will be based on sensors that can work over the bed mattress (ENORA Prototype Mattress Topper Pressure Sensor) and/or under the bed mattress (Under-mattress Pneumatic Sensor provided by vendor Withings). In both cases all data are collected data in the ENORA Cloud Platform to apply ML algorithms for sleep assessment, as is depicted in the following Figure
Sleep analysis has long been a vital yet complex element in healthcare, and the Enora Unobtrusive Sleep Monitoring and Assessment AI-driven platform represents a significant advancement in this field. With Enora's cutting-edge tools, including the Time Series Annotator and the innovative mattress topper pressure sensor, sleep studies have become more intuitive and less invasive. This tool allows for the effortless annotation of sleep data and provides detailed insights into patients' sleep patterns without the need for wearables, revolutionizing our approach to monitoring conditions like Parkinson’s disease.
The ENORA Unobtrusive Sleep Monitoring and Assessment AI-driven platform, with its user-friendly interface and advanced visualization techniques, transforms raw data into a narrative of nightly rest. This narrative aids healthcare professionals in understanding the quality and structure of sleep, offering a comprehensive view that was previously difficult to capture. The integration of these tools with the Enora AI toolkit and big data analytics marks a leap forward in personalized healthcare, enabling actionable recommendations for patients based on their unique data.

The ENORA Unobtrusive Sleep Monitoring and Assessment is readily available across multiple devices such as smartphones and laptops. To gain entry, doctors must undergo a user registration via AIH. This step provides them with secure credentials, ensuring protected access to the ENORA Unobtrusive Sleep Monitoring and Assessment tools.
The login page of the annotator tool can be found at:
https://annotator.enorainnovation.com/Annotator/login.html

The user credentials are the ones given by the IaM Tool. Before using the application, you must register the patients.
2.Time series Annotator
Allows the user to select the device (Sleep Analyzer) or the patient, it will bring all the data for this selection and allow the user to make annotation on areas of the time series. Via a step by step approach the user can select the area, select the patient condition and enter a predefined tag or enter a new custom one.
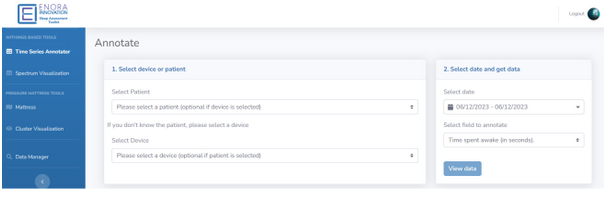
Select patient and date /sensor
3.Night visualization – high level
Offers a high-level result of the sleep assessment. It is a spectrum-based UI that offers a whole night approach and a quick understanding of the patients’ sleep. The visualization is based on the thresholds and when a threshold is passed then an amber night is marked, if more are passed then a purple alert is raised.
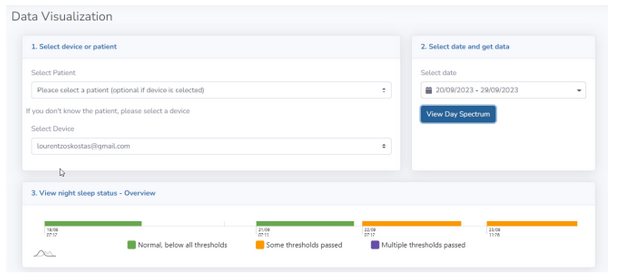
High level night visualization
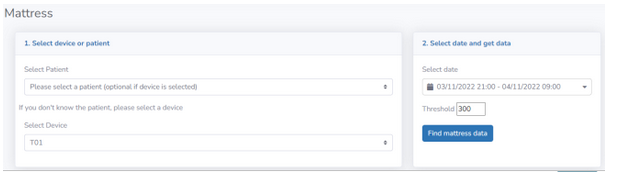
4.Raw data mattress pressure sensor
This UI is used only for the Enora Mattress Topper prototype. It displays the position per data packet of the patient on the bed.
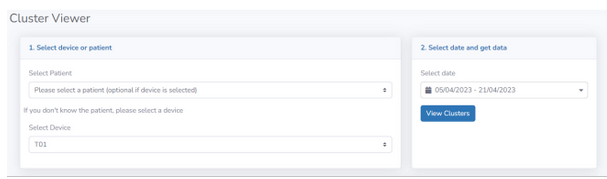
5.Cluster visualization of (PCA, K-Means clustering)
This tool displays the result (clustering) of the data per patient or device after PCA and Birch clustering methods.