1.Introduction
The ENORA Unobtrusive Sleep Monitoring and Assessment is readily available across multiple devices such as smartphones and laptops. To gain entry, doctors must undergo a user registration via AIH. This step provides them with secure credentials, ensuring protected access to the ENORA Unobtrusive Sleep Monitoring and Assessment tools.
The login page of the annotator tool can be found at:
https://annotator.enorainnovation.com/Annotator/login.html
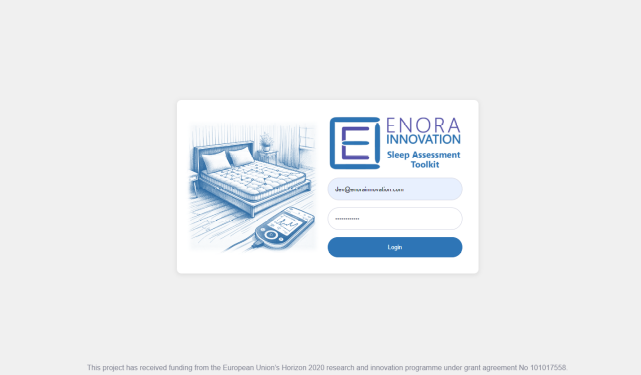
The user credentials are the ones given by the IaM Tool. Before using the application, you must register the patients.
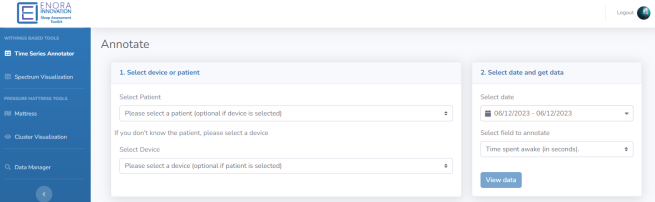
2.Time series Annotator
Allows the user to select the device (Sleep Analyzer) or the patient, it will bring all the data for this selection and allow the user to make annotation on areas of the time series. Via a step by step approach the user can select the area, select the patient condition and enter a predefined tag or enter a new custom one.
Steps:
-
Select patient or device. Normally each patient (via the IaM UI) is mapped to a device for a period of time. So if this process is complete the doctor can select the patient that their data is need to be visualized / annotated. If this process is not done, then by selecting the device the doctor can visualize the data coming from a device regardless of the patient.
-
Select the time period for this patient and the sensor (measurement feature) to visualize. Click view data to view the data for the specified filters
-
Select an area by clicking and marking on the graph.
-
Select the patient condition, enter a custom tag and store the data, click “Save Data”.
3.Night visualization – high level
Offers a high-level result of the sleep assessment. It is a spectrum-based UI that offers a whole night approach and a quick understanding of the patients’ sleep. The visualization is based on the thresholds and when a threshold is passed then an amber night is marked, if more are passed then a purple alert is raised.
Steps:
-
Select patient or device. Normally each patient (via the IaM UI) is mapped to a device for a period of time. So if this process is complete the doctor can select the patient that their data is need to be visualized / annotated. If this process is not done, then by selecting the device the doctor can visualize the data coming from a device regardless of the patient.
-
Select the time period for this patient and the sensor (measurement feature) to visualize. Click view data to view the data for the specified filters
-
Visualize each night, if a night is not colored then no data exist for this night.
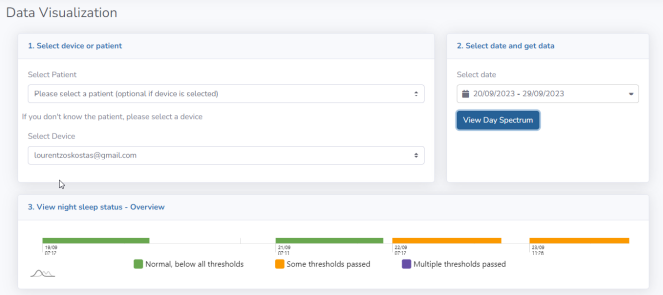
High level night visualization
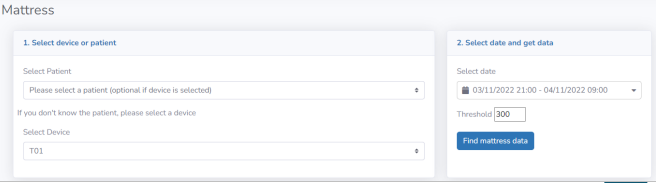
4.Raw data mattress pressure sensor
This UI is used only for the Enora Mattress Topper prototype. It displays the position per data packet of the patient on the bed.
Steps:
-
Select patient or device. Normally each patient (via the IaM UI) is mapped to a device for a period of time. So if this process is complete the doctor can select the patient that their data is need to be visualized / annotated. If this process is not done, then by selecting the device the doctor can visualize the data coming from a device regardless of the patient.
-
Select the time period for this patient and the sensor (measurement feature) to visualize. The threshold adjusts the pressure sensor sensitivity, an average value of 300 is preset. Click view data to view the data for the specified filters
-
Visualize the position of the patient on the bed. To view the night as a video; just use the buttons play, pause and stop. It will automatically loop through the data and visualize the sleep positions.
-
The bottom screen displays a split view of the body into 3; lower body, torso, head. It displays the PCA (principal component analysis) result as histogram highlighting the hour of the night in comparison with the rest hours.
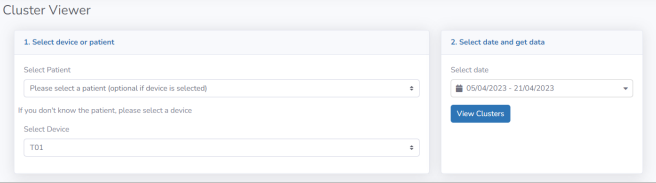
5.Cluster visualization of (PCA, K-Means clustering)
This tool displays the result (clustering) of the data per patient or device after PCA and Birch clustering methods.
Steps:
-
Select patient or device. Normally each patient (via the IaM UI) is mapped to a device for a period of time. So if this process is complete the doctor can select the patient that their data is need to be visualized / annotated. If this process is not done, then by selecting the device the doctor can visualize the data coming from a device regardless of the patient.
-
Select the time period for this patient and the sensor (measurement feature) to visualize. Click view data to view the data for the specified filters
-
View the cluster / category of the night in comparison to the other nights and what group they belong to.
6.IaM and data mapping
How to join devices with patients on IaM.
(The login URL is https://iam.alamedaproject.eu/signin )
Once you have added devices and patients (this tutorial doesn’t cover this process). You need to join the device and patient for a time period.
Patients have a small “tablet” icon.
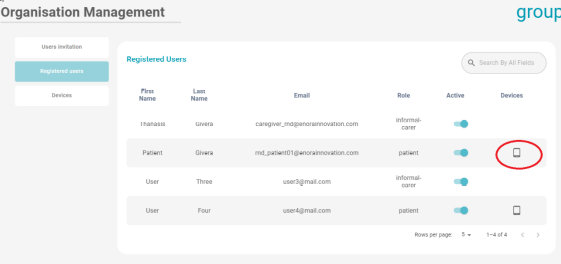
The user can add, edit or remove the connection time periods of the device and the patient.